Wednesday 29 June 2011

Gold, NZDUSD, Oil and Wall Street ...

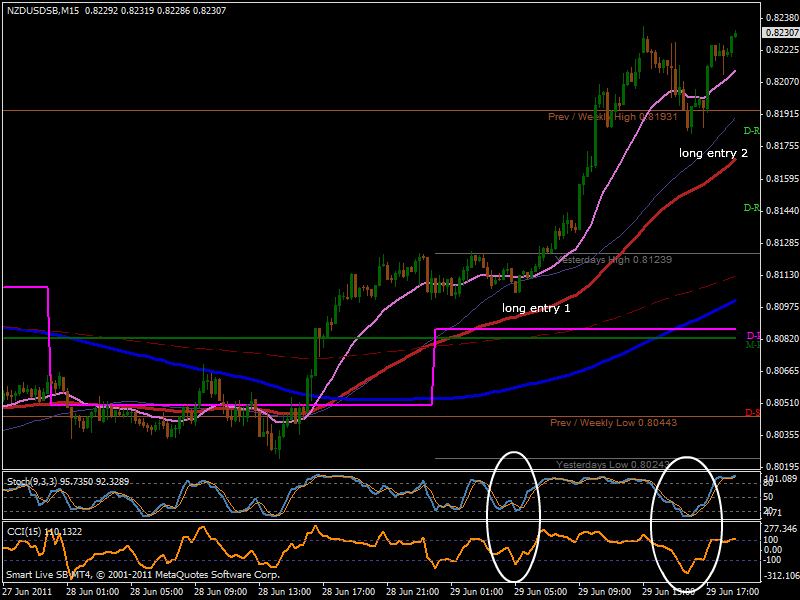
      These are examples on gold, nzdusd (kiwi dollar), oil and wall street that the combination of CCI and stochastic really work as your trigger. The crossing of their respective lowest levels up for longs or their highest levels down for shorts is very significant and a powerful tool.
      Below you'll find screen shots of the above markets today. Quite a hard day for trading, especially with the problems in Greece and the massive spikes on cable and euro dollar, but with a bit of patience to wait for the trigger and money management one could've made at least 100 pips.

The white circle shows stochastic and cci below their lowest levels (20 and -150 respectively) but crossing them upwards. This is the trigger to enter long above the previous candle.

The above only applies when the purple ema is above the red ema. 


Wednesday 4 May 2011

Aussie dollar - First trade in a long time

I took this one this morning after a long time without even looking at the charts.

The purple ema was below the red ema.
CCI and Stochastic were at their respective highest levels heading down.

Entry, SL and TP market in the picture.

Wednesday 23 March 2011

EUR/USD - pips in!

Everybody knows that deciding to stay out of the market is as hard as deciding to go long or short. Since the unfortunate events in Japan and Libya, the market has been hard to read and unappealing to me.

I entered this trade yesterday night following the signal Y (as shown on the chart) but one could've entered it today on signal T.

Entry: 1.4186
SL: 1.4219 (above previous high)
TP: 1.4136 (MR-2 or today's DR-2)

Yes, i know it was a conservative TP and i could have made another 30 pips.

Total profit: 50 pips

Wednesday 16 March 2011

USD/CAD - Update

This is an update from the trade i mentioned in the last.

I'm glad i bought half-stake at 30 pips ...

I had to go out and decided to move my SL to 0.9923. "Pips in" but not as many as i'd have liked.

USD/CAD Half-way through

This trade is still ongoing ...

15min chart
Entry, SL and TP are marked on the chart but you'll notice that there's no trigger to enter this trade...


This is because the trigger is from the 1h chart, as shown below.
 
1h chart


I've sold half-stake when price reached 30 pips and brought SL to BE.

Thursday 10 March 2011

Perfect setup on cable (gbpusd) ... Pips in!


Today was a dangerous day to trade cable because of all the main news coming out (i.e. Manufacturing Production and Official Bank Rate) so i used 1/3 of my normal stake.

Before - click to enlarge


I marked on chart my entry point and stop loss.

Purple ema (20) is below the red ema (80). CCI and Stochastic are moving in unison from their highest levels toward their respectively lowest levels. 
After - click to enlarge
Some time later and this is the result.


My target profit was at W-S1 (weekly support 1) but as you can see i could've made more pips all the way to D-S2 (daily pivot support 2).
I'm happy with this being my only trade of the day with  47 pips of profit.

Another perfect setup on Aussie 1h chart

I didn't take this one but it was another example of a perfect setup.

 The vertical red line shows the trigger for a short trade, since this pair was in a down trend and the purple 20 ema was below the red 80 ema.

Entry point is shown with a down arrow, stop loss with a X and target profit the green hand.


If i were in i'd have bought half-stake when the price reached my yellow support line, bring SL to BE and let the other half hit the TP.