Wednesday 29 June 2011

Gold, NZDUSD, Oil and Wall Street ...

      These are examples on gold, nzdusd (kiwi dollar), oil and wall street that the combination of CCI and stochastic really work as your trigger. The crossing of their respective lowest levels up for longs or their highest levels down for shorts is very significant and a powerful tool.
      Below you'll find screen shots of the above markets today. Quite a hard day for trading, especially with the problems in Greece and the massive spikes on cable and euro dollar, but with a bit of patience to wait for the trigger and money management one could've made at least 100 pips.

The white circle shows stochastic and cci below their lowest levels (20 and -150 respectively) but crossing them upwards. This is the trigger to enter long above the previous candle.

The above only applies when the purple ema is above the red ema. 


Wednesday 4 May 2011

Aussie dollar - First trade in a long time

I took this one this morning after a long time without even looking at the charts.

The purple ema was below the red ema.
CCI and Stochastic were at their respective highest levels heading down.

Entry, SL and TP market in the picture.

Wednesday 23 March 2011

EUR/USD - pips in!

Everybody knows that deciding to stay out of the market is as hard as deciding to go long or short. Since the unfortunate events in Japan and Libya, the market has been hard to read and unappealing to me.

I entered this trade yesterday night following the signal Y (as shown on the chart) but one could've entered it today on signal T.

Entry: 1.4186
SL: 1.4219 (above previous high)
TP: 1.4136 (MR-2 or today's DR-2)

Yes, i know it was a conservative TP and i could have made another 30 pips.

Total profit: 50 pips

Wednesday 16 March 2011

USD/CAD - Update

This is an update from the trade i mentioned in the last.

I'm glad i bought half-stake at 30 pips ...

I had to go out and decided to move my SL to 0.9923. "Pips in" but not as many as i'd have liked.

USD/CAD Half-way through

This trade is still ongoing ...

15min chart
Entry, SL and TP are marked on the chart but you'll notice that there's no trigger to enter this trade...


This is because the trigger is from the 1h chart, as shown below.
 
1h chart


I've sold half-stake when price reached 30 pips and brought SL to BE.

Thursday 10 March 2011

Perfect setup on cable (gbpusd) ... Pips in!


Today was a dangerous day to trade cable because of all the main news coming out (i.e. Manufacturing Production and Official Bank Rate) so i used 1/3 of my normal stake.

Before - click to enlarge


I marked on chart my entry point and stop loss.

Purple ema (20) is below the red ema (80). CCI and Stochastic are moving in unison from their highest levels toward their respectively lowest levels. 
After - click to enlarge
Some time later and this is the result.


My target profit was at W-S1 (weekly support 1) but as you can see i could've made more pips all the way to D-S2 (daily pivot support 2).
I'm happy with this being my only trade of the day with  47 pips of profit.

Another perfect setup on Aussie 1h chart

I didn't take this one but it was another example of a perfect setup.

 The vertical red line shows the trigger for a short trade, since this pair was in a down trend and the purple 20 ema was below the red 80 ema.

Entry point is shown with a down arrow, stop loss with a X and target profit the green hand.


If i were in i'd have bought half-stake when the price reached my yellow support line, bring SL to BE and let the other half hit the TP.

Monday 7 March 2011

Topping it up with cable (gbpusd) ...


    Trading is like playing football or racing cars or telling jokes. It's a performance. You have good days and bad days and what happens in your life will, unfortunately, affect your decisions. Let's just say that i didn't get much rest on the weekend.

     Before getting it wrong earlier on with Euro, i placed an order on cable to go short, as i thought it needed a correction before moving higher again. My theory was based on Fibonacci, so i knew exactly where i wanted the price to go before i could go long again. I usually look at the 50% and 61.8% levels as possible reversals , so when placing my order at 1.6247 i was expecting a TP around the 50% level.

Fibonacci on the 1h chart

 I must confess that my heart sank when i saw cable shoot up through DP almost 60 pips without taking me with him...

Entry, SL and TP on 15min
 I also feel obliged to admit that i had forgotten my order on cable placed at 7:40am (GMT) when it was triggered in the afternoon.


The good thing is that my TP was eventually reached. 


When price reached D-S1 i bought back half-stake, set SL to BE and let the rest run.

Aussie saving the day.


After jumping the gun on Euro earlier in the day, and knowing how Aussie and Euro are related, i decided to place a long order on Aussie.
Before
My entry is justified by higher highs and higher lows and a consolidation around the daily pivot, when the 20 ema (purple) was flirting with the 80 ema (red) not knowing exactly where to go.

I knew, or hoped, that i priced broke the weekly pivot, it could reach D-R1. 


After


TP reached at D-R1 and trade closed to a profit of  32 pips.

Jumping the gun on Euro ...

      I woke up today and sat in front of my computer 15 min before this screen cap was taken:

 CCI had touched the -100 and more often than not this is enough to justify an entry, even though stoch didn't quite get there.

You can see on the pic to the left where i place my entry order, SL and TP.


Moments later, this happened:
This is a much more valid entry point than the first one. Now both CCI and Stoch are moving from their lowest levels toward their highest. 

I believe i also misplaced my SL in the first entry to make it look better in terms of risk ratio. 

Needless to say that i got stopped out for a loss, but had i placed my SL below the previous low or had i waited for a confirmation from stochastic, i'd have been 30+ pips up now. At this moment i'd probably sell half-stake and move SL to BE.

Monday 28 February 2011

"Before and After" 15min USD/CAD trade + SLIPPAGE - 28/02

Another post from the series BEFORE and AFTER.

This is a 15min chart of USD/CAD of this morning. 

BEFORE - click to enlarge
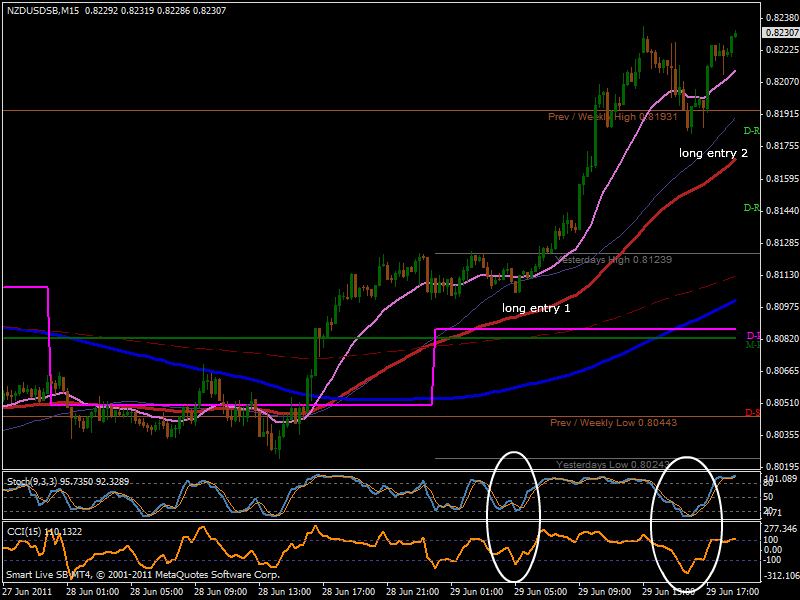
There are notes on the picture, but it's same basic principle.
1º) Purple ema (20) is below the Red ema (80)
2º) The pair is in a downtrend, as it presents lower lows and lower highs.
3º) CCI is above 100 but starting to move down.
      Stoch is above (or touching) 80 but starting to move down.


Entry: 0.9768
SL: 0.9793 just above D-P (daily pivot)
TP: 0.9729 at D-S2 (daily pivot second support)

This is the "after" chart with TP reached.

AFTER - click to enlarge
USDCAD is still moving down as i write and has reached W-S1 (weekly pivot first support) but i'm out.


SLIPPAGE

I admit i never took slippage too seriously. I know it happens and i know how it can affect a trader, but perhaps i should take the slippage factor into consideration when choosing a broker. Even though my entry was at 0.9768, the order was only kicked in at 0.9757, 11 pips below. 
I found this article that explains slippage. http://www.financial-spread-betting.com/Slippage.html

"Before and After" 15min AUD/USD trade


Today i had the brilliant idea of taking a screen shot of the before and after. 

Below is the 15min AUD/USD chart this morning.


My reasoning behind this trade was purely based on the entry rules of the strategy.
1º) Purple (20) ema above the Red (80) ema
2º) Succession of higher highs and higher lows, which characterise an up trend
3º) CCI below -100 but moving back towards the positive side. 
      Stoch below 20 but moving back towards the positive side.


Entry: 1.01557
SL: 1.0115 (below previous low)
TP: 1.0192 at M-R1 (monthly pivot first resistance) 

This is the "after" chart with TP reached. 


I didn't close the trade at TP. I closed half stake, brought SL to BE+ 5pips and decided to let the trade run.


UPDATE

As i said before, i didn't close the trade at TP but decided to let it run a bit longer. I'm glad to say that i woke up today to a nice profit.


You can see two dashed lines. The top one shows my new TP and the bottom one shows the original TP.

Friday 25 February 2011

Short trade on cable (GBP/USD) - 24 to 25/02 Pips in!


Perfect setup but this time i took it. 

The red vertical line shows the trigger. Purple below the red, CCI and Stochastic moved all the way up and then started moving down. 

My entry was a 1.6132 (below previous low), SL just above DP and previous highs and target profit WS-1, which today is almost at the same level of D-S1.

I actually bought half-stake at around 1.6079 and brought SL to BE and let the rest run to TP.

Thursday 24 February 2011

NZD/USD 24/02


   Another perfect setup that i missed.

Purple ema above red ema. CCI and Stochastic moving in unison from their respective lowest levels towards their highest. 
Entry point at the green arrow. Stop loss at the white cross. TP would be at D-R1 for half-stake, then bring SL to break even and let it run to the next resistance.

Wednesday 26 January 2011

15min EUR/USD - 23/02


     I didn't take this one but it was a perfect setup...

The first picture shows the chart without comments, so you can try and spot  the entry point. 
Click to enlarge


Note the vertical red line and try to concentrate only to the left of it. Euro is in an uptrend (higher highs and higher lows) and the purple ema (20) is above the red ema (80). Now look at the indicators at the bottom. Both CCI and Stochastic move at the same time from below (or touching) their lowest levels (the horizontal dashed lines) towards their highest levels. They are your trigger.


The entry point is marked by the green arrow, just above the previous candle at around 1.3714. Stop loss (white cross) below previous low and, for safety, below the red ema at around 1.3676. After the initial movement, stop loss could have been moved to break even or to the point marked by the orange cross.
Target profit would be at D-R2 (D-R1 was too close) or based on a number of pips. The stop loss was 38 pips, so TP would have to be 38+ minimum. 
Another option would be to sell half stake when you reach 30pips and bring SL to BE.

Two other entries (one before and one after) were still possible in the same chart. They were not perfect setups as the stochastic was not as synchronised with the CCI.